Summary
I wrote (with the help of a friendly LLM) and open-sourced an app to make it easy to extract diagrams, charts, etc. from PDFs to SVG, which being a vector format, are clear at any resolution. If you want to try it out, see the README for the overview and installation instructions. This post and the GitHub repo provide similar usage instructions.
The problem
Reading a number of blog posts, some discussing research papers, I see a lot of posts including screenshots of charts, diagrams, algorithms, and other extracts from papers. Many times, if I’m reading these posts on a mobile phone, I may want to zoom into them to see more details, but because these screenshots are typically in raster images (such as PNG or JPG) means that they are pixelated and fuzzy when zooming in.
Here’s a diagram from Wikipedia that shows this in more detail:

However, the source file has them as vectors in the PDF, so why don’t we export the vector data directly, e.g., to SVG file? Why doesn’t everyone do that?
Turns out, this is harder than it sounds. Having looked into this, most suggestions are pointing to using Inkscape, an vector drawing and editing software as the mechanism. However, having tried it out, it’s quite difficult to extract and save a diagram from a PDF into a self-contained SVG file (a few times that I’ve tried it, I got a strangely garbled SVG, and didn’t investigate further).
The other suggestions are to extract the entire page, but that doesn’t address the use case of extracting just a single diagram.
Solutions
Since the simple and obvious solution didn’t work, what might we need to do?
I imagined this may require something like …
- writing a new PDF renderer, which renders to an SVG file instead of the screen
- integrating with some PDF parsing / display library or toolkit to do the same
- writing a virtual display driver that saves vector drawing operations as SVG paths instead of writing to the screen
or something similar to those in terms of complexity. As a result, I didn’t make much progress on this, as it seemed like the cost of solving the problem is too high, given the return on investment.
Until recently, when I asked Gemini what it thought of my problem and my proposed solutions. To my surprise, Gemini didn’t just agree with me and start writing a PDF parser or renderer, but told me that my solution is too complex and there are simpler ways of solving the issue, and it gave me several options.
One of the options was a surprisingly simple Python file, which was confusing, as I expected this would require much more code. Turned out, it was using the Poppler command-line tools to get PDF file metadata, render a page-at-a-time to image (for display), and extract a region from a PDF to SVG, wrapped in a nice GUI based on the Qt library.
After some back-and-forth, manual and Gemini-assisted bugfixes and cleanups, adding linting and type checking (and more cleanups), along with some follow-on development with Antigravity, I now have an initial version of an app I’d like to share with you.
Visual comparison
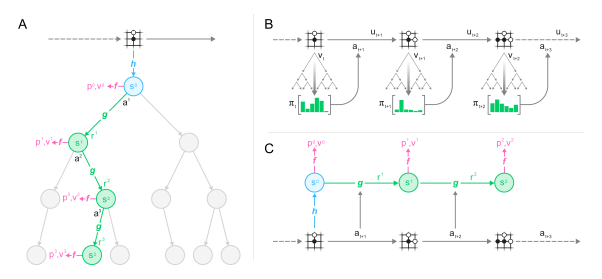
For example, let’s take the paper Mastering Atari, Go, Chess and Shogi by Planning with a Learned Model. Below is a comparison of fig. 1 (pg 3) in that paper in two formats: one as vectors extracted to SVG using the app, and the other one a traditional screenshot as PNG.
Fig. 1 extracted via the app (SVG)

Fig. 1 traditional screenshot (PNG)
It might look like they’re identical, but to see the difference, try zooming in your browser window:, or pinch to zoom on a phone or tablet.1
Tip: to make it even easier to zoom, right-click (or tap and hold) on each image, select “open image in a new tab,” and then try zooming in on each.
Once you do that, you’ll quickly see that it’s hard to see the details in a diagram that’s in PNG, as it quickly becomes blurry or fuzzy at higher zoom levels, while the SVG version continues to be sharp even at maximum zoom.
Here are the key combinations for zooming in and out and resetting zoom level for browsers such as Chrome, Safari, and Firefox (shortcuts only differ by platform):
| Linux or Windows | macOS | |
|---|---|---|
| Zoom in | Ctrl + | ⌘ + |
| Zoom out | Ctrl - | ⌘ - |
| Reset zoom | Ctrl 0 | ⌘ 0 |
App overview
So with that in mind, let’s take a quick look at the app itself.
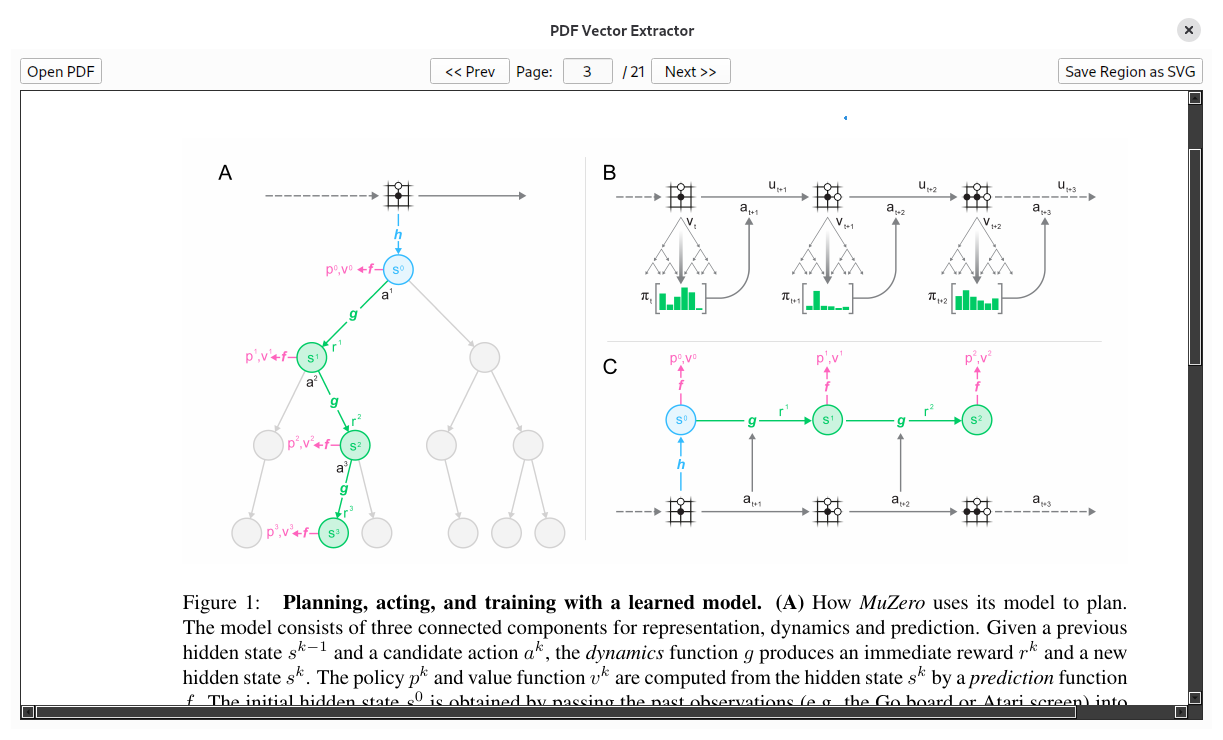
When you first run the app, you will see a (mostly empty) window. Click on “Open PDF” in the upper-left, find the file you want to read and you will see something like the following:
You can click and drag the mouse where the paper is rendered to draw a selection rectangle, which will look as follows:
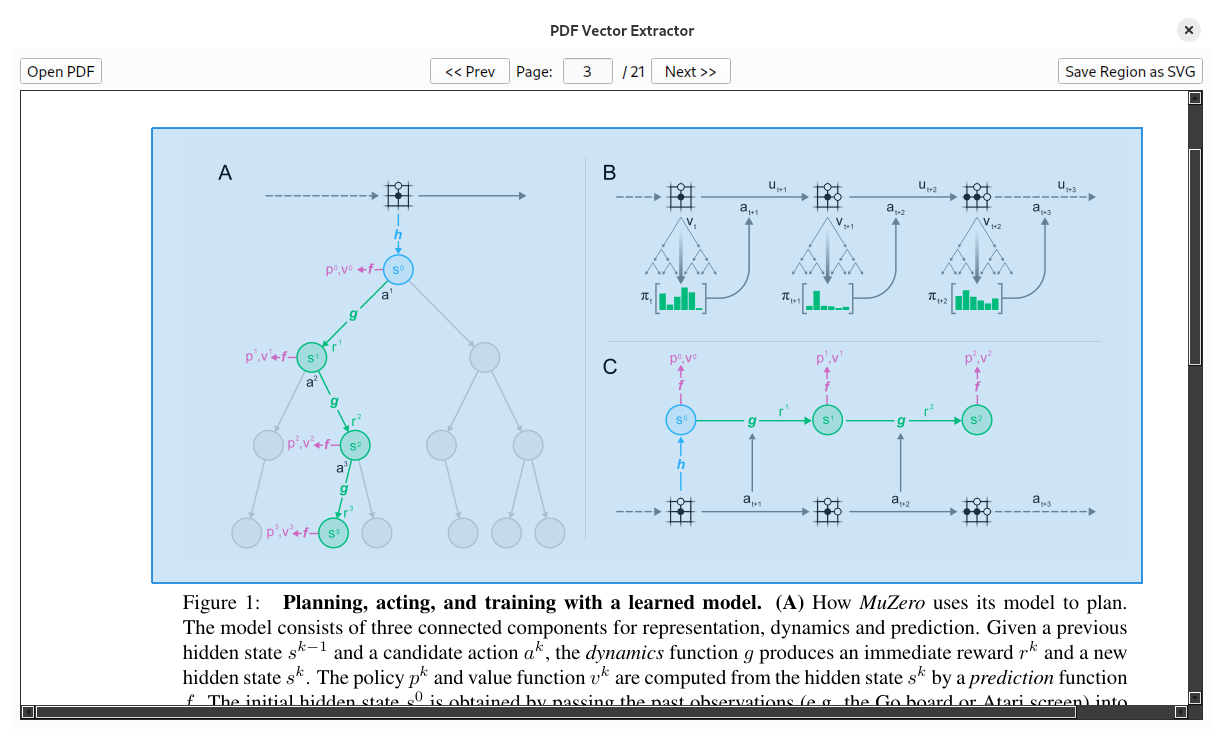
Once you’re happy with your selection, click on the “Save Region as SVG” button in the upper-right and save your file. The above SVG file was created in this fashion.
Note that you can also move your selection, but resizing the selection is not yet possible. Let me know if this would be useful on this GitHub issue.
Conclusion
And that’s it! It’s a very simple app. If this is of interest to you, please try it out, and let me know what you think!
Hopefully, we’ll start seeing more vector-based diagrams in blog posts that will improve the readability (and zoomability) of these pages.
One workaround I’ve noticed some folks take is that they screenshot the PNG at a much higher resolution than is typically used for web pages, and then set height/width parameters, or let the browser shrink it automatically to fit the page region. Then, zooming in does not cause the diagram to become blurry quickly, because it is naturally of a much higher size. That’s fine. but would probably be much more efficient (in terms of file size) by using an SVG, which scales arbitrarily. ↩︎